Water Properties
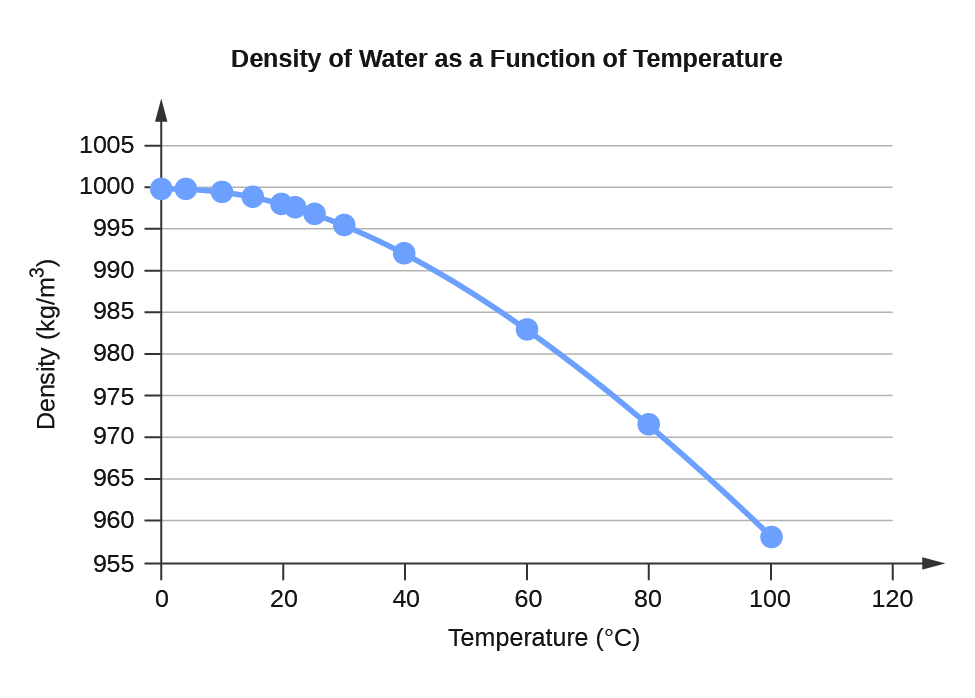
| Water Density (kg/m3) at Different Temperatures (°C) |
| Temperature |
Density |
| 0 |
999.8395 |
| 4 |
999.9720 (density maximum) |
| 10 |
999.7026 |
| 15 |
999.1026 |
| 20 |
998.2071 |
| 22 |
997.7735 |
| 25 |
997.0479 |
| 30 |
995.6502 |
| 40 |
992.2 |
| 60 |
983.2 |
| 80 |
971.8 |
| 100 |
958.4 |
 <table summary="A table with three columns and 23 rows is titled “Water Vapor Pressure at Different Temperatures ( degrees Celsius ).” The first row contains the title “Temperature” in the left column, the title “Vapor Pressure ( torr )” in the middle column, and the title “Vapor Pressure ( pascals )” in the right column. The next row contains the number 0 in the left column, the number 4.6 in the middle column, and the number 613.2812 in the right column. The next row contains the number 4 in the left column, the number 6.1 in the middle column, and the number 813.2642 in the right column. The next row contains the number 10 in the left column, the number 9.2 in the middle column, and the number 1226.562 in the right column. The next row contains the number 15 in the left column, the number 12.8 in the middle column, and the number 1706.522 in the right column. The next row contains the number 20 in the left column, the number 17.5 in the middle column, and the number 2333.135 in the right column. The next row contains the number 22 in the left column, the number 19.8 in the middle column, and the number 2639.776 in the right column. The next row contains the number 25 in the left column, the number 23.8 in the middle column, and the number 3173.064 in the right column. The next row contains the number 30 in the left column, the number 31.8 in the middle column, and the number 4239.64 in the right column. The next row contains the number 35 in the left column, the number 42.2 in the middle column, and the number 5626.188 in the right column. The next row contains the number 40 in the left column, the number 55.3 in the middle column, and the number 7372.707 in the right column. The next row contains the number 45 in the left column, the number 71.9 in the middle column, and the number 9585.852 in the right column. The next row contains the number 50 in the left column, the number 92.5 in the middle column, and the number 12332.29 in the right column. The next row contains the number 55 in the left column, the number 118.0 in the middle column, and the number 15732 in the right column. The next row contains the number 60 in the left column, the number 149.4 in the middle column, and the number 19918.31 in the right column. The next row contains the number 65 in the left column, the number 187.5 in the middle column, and the number 24997.88 in the right column. The next row contains the number 70 in the left column, the number 233.7 in the middle column, and the number 31157.35 in the right column. The next row contains the number 75 in the left column, the number 289.1 in the middle column, and the number 38543.39 in the right column. The next row contains the number 80 in the left column, the number 355.1 in the middle column, and the number 47342.64 in the right column. The next row contains the number 85 in the left column, the number 433.6 in the middle column, and the number 57808.42 in the right column. The next row contains the number 90 in the left column, the number 525.8 in the middle column, and the number 70100.71 in the right column. The next row contains the number 95 in the left column, the number 633.9 in the middle column, and the number 84512.82 in the right column. The next row contains the number 100 in the left column, the number 760.0 in the middle column, and the number 101324.7 in the right column." class="span-all"><thead>
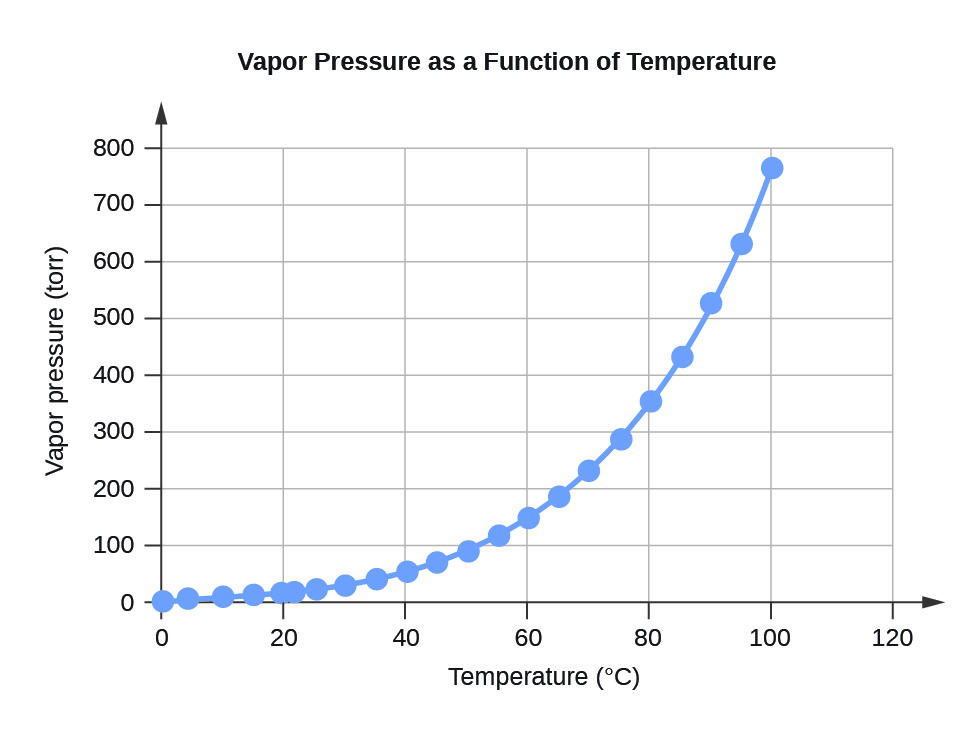
| Water Vapor Pressure at Different Temperatures (°C) |
| Temperature |
Vapor Pressure (torr) |
Vapor Pressure (Pa) |
</thead><tbody>
| 0 |
4.6 |
613.2812 |
| 4 |
6.1 |
813.2642 |
| 10 |
9.2 |
1226.562 |
| 15 |
12.8 |
1706.522 |
| 20 |
17.5 |
2333.135 |
| 22 |
19.8 |
2639.776 |
| 25 |
23.8 |
3173.064 |
| 30 |
31.8 |
4239.64 |
| 35 |
42.2 |
5626.188 |
| 40 |
55.3 |
7372.707 |
| 45 |
71.9 |
9585.852 |
| 50 |
92.5 |
12332.29 |
| 55 |
118.0 |
15732 |
| 60 |
149.4 |
19918.31 |
| 65 |
187.5 |
24997.88 |
| 70 |
233.7 |
31157.35 |
| 75 |
289.1 |
38543.39 |
| 80 |
355.1 |
47342.64 |
| 85 |
433.6 |
57808.42 |
| 90 |
525.8 |
70100.71 |
| 95 |
633.9 |
84512.82 |
| 100 |
760.0 |
101324.7 |
</tbody></table>
 <table summary="A table with three columns and 16 rows is titled “Water K subscript W and pK subscript W at Different Temperatures ( degrees Celsius ).” The first row contains the title “Temperature” in the left column, the title “K subscript W, 10 superscript negative 14” in the middle column, and the title “pK subscript W superscript 2” in the right column. The next row contains the number 0 in the left column, the number 0.112 in the middle column, and the number 14.95 in the right column. The next row contains the number 5 in the left column, the number 0.182 in the middle column, and the number 14.74 in the right column. The next row contains the number 10 in the left column, the number 0.288 in the middle column, and the number 14.54 in the right column. The next row contains the number 15 in the left column, the number 0.465 in the middle column, and the number 14.33 in the right column. The next row contains the number 20 in the left column, the number 0.671 in the middle column, and the number 14.17 in the right column. The next row contains the number 25 in the left column, the number 0.991 in the middle column, and the number 14.00 in the right column. The next row contains the number 30 in the left column, the number 1.432 in the middle column, and the number 13.84 in the right column. The next row contains the number 35 in the left column, the number 2.042 in the middle column, and the number 13.69 in the right column. The next row contains the number 40 in the left column, the number 2.851 in the middle column, and the number 13.55 in the right column. The next row contains the number 45 in the left column, the number 3.917 in the middle column, and the number 13.41 in the right column. The next row contains the number 50 in the left column, the number 5.297 in the middle column, and the number 13.28 in the right column. The next row contains the number 55 in the left column, the number 7.080 in the middle column, and the number 13.15 in the right column. The next row contains the number 60 in the left column, the number 9.311 in the middle column, and the number 13.03 in the right column. The next row contains the number 75 in the left column, the number 19.95 in the middle column, and the number 12.70 in the right column. The next row contains the number 100 in the left column, the number 56.23 in the middle column, and the number 12.25 in the right column." class="span-all"><thead>
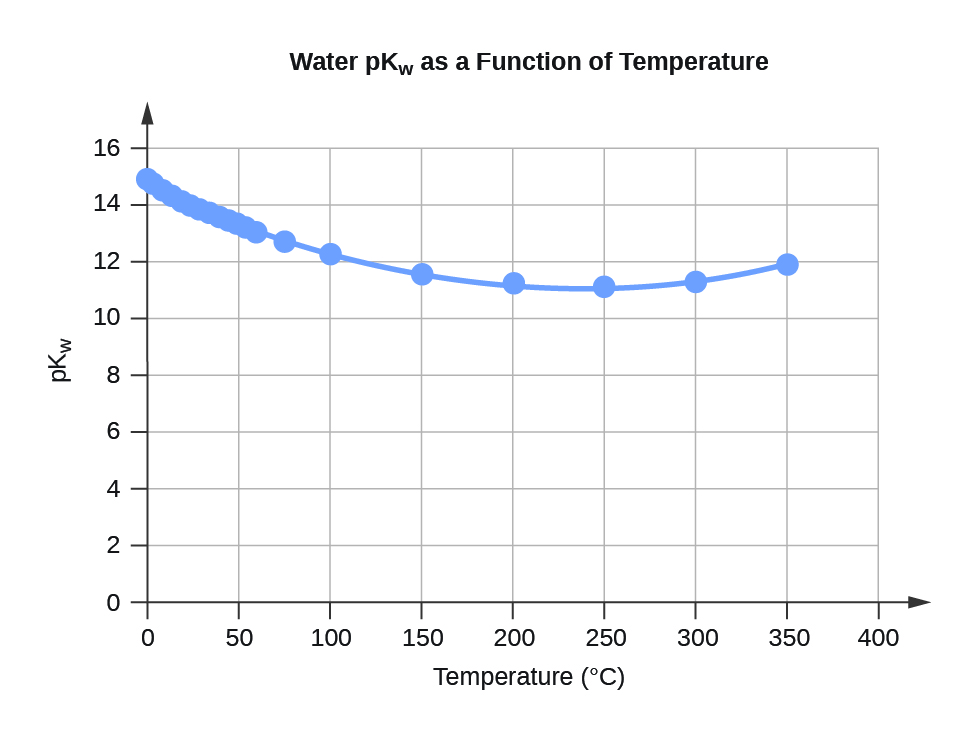
| Water Kw and pKw at Different Temperatures (°C) |
| Temperature |
Kw 10–14 |
pKw |
</thead><tbody>
| 0 |
0.112 |
14.95 |
| 5 |
0.182 |
14.74 |
| 10 |
0.288 |
14.54 |
| 15 |
0.465 |
14.33 |
| 20 |
0.671 |
14.17 |
| 25 |
0.991 |
14.00 |
| 30 |
1.432 |
13.84 |
| 35 |
2.042 |
13.69 |
| 40 |
2.851 |
13.55 |
| 45 |
3.917 |
13.41 |
| 50 |
5.297 |
13.28 |
| 55 |
7.080 |
13.15 |
| 60 |
9.311 |
13.03 |
| 75 |
19.95 |
12.70 |
| 100 |
56.23 |
12.25 |
</tbody></table>
 | Specific Heat Capacity for Water |
{: valign=”middle”}|———-
| C°(H2O(l)) = 4184 J∙K−1∙kg−1 = 4.184 J∙g-1∙°C-1 |
{: valign=”middle”}| C°(H2O(s)) = 1864 J∙K−1∙kg−1 |
{: valign=”middle”}| C°(H2O(g)) = 2093 J∙K−1∙kg−1 |
{: valign=”middle”}{: summary=”A table with one column and three rows is titled “Specific Heat Capacity for Water.” The first row contains the equation “C superscript 0 ( H subscript 2 O ( liquid ) ) equals 4179 J per K superscript negative one per kg superscript negative one. The next row contains the equation “C superscript 0 ( H subscript 2 O ( solid ) ) equals 1864 J per K superscript negative one per kg superscript negative one. The next row contains the equation “C superscript 0 ( H subscript 2 O ( gas ) ) equals 2093 J per K superscript negative one per kg superscript negative one.” .span-all}
| Specific Heat Capacity for Water |
{: valign=”middle”}|———-
| C°(H2O(l)) = 4184 J∙K−1∙kg−1 = 4.184 J∙g-1∙°C-1 |
{: valign=”middle”}| C°(H2O(s)) = 1864 J∙K−1∙kg−1 |
{: valign=”middle”}| C°(H2O(g)) = 2093 J∙K−1∙kg−1 |
{: valign=”middle”}{: summary=”A table with one column and three rows is titled “Specific Heat Capacity for Water.” The first row contains the equation “C superscript 0 ( H subscript 2 O ( liquid ) ) equals 4179 J per K superscript negative one per kg superscript negative one. The next row contains the equation “C superscript 0 ( H subscript 2 O ( solid ) ) equals 1864 J per K superscript negative one per kg superscript negative one. The next row contains the equation “C superscript 0 ( H subscript 2 O ( gas ) ) equals 2093 J per K superscript negative one per kg superscript negative one.” .span-all}
| Standard Water Melting and Boiling Temperatures and Enthalpies of the Transitions |
|
Temperature (K) |
ΔH (kJ/mol) |
| melting |
273.15 |
6.088 |
| boiling |
373.15 |
40.656 (44.016 at 298 K) |
| Water Cryoscopic (Freezing Point Depression) and Ebullioscopic (Boiling Point Elevation) Constants |
{: valign=”middle”}|———-
| Kf = 1.86°C∙kg∙mol−1 (cryoscopic constant) |
{: valign=”middle”}| Kb = 0.51°C∙kg∙mol−1 (ebullioscopic constant) |
{: valign=”middle”}{: summary=”A table with one column and two rows is titled “Water Cryoscopic ( Freezing Point Depression ) and Ebullioscopic ( Boiling Point Elevation ) Constants.” The first row contains the equation “K subscript f equals 1.86 K mol superscript negative one kg superscript negative one,” directly to the left of the text “( cryoscopic constant ).” The next row contains the equation “K subscript b equals 0.51 mol superscript negative one kg superscript negative one,” directly to the left of the text “( ebullioscopic constant ).”” .span-all}
 after which the intensity of a light beam passing through water decays by a factor of the base of the natural logarithm e (e = 2.718281828).")

This work is licensed under a Creative Commons Attribution 4.0 International License.
You can also download for free at http://cnx.org/contents/85abf193-2bd2-4908-8563-90b8a7ac8df6@12.1
Attribution: