.")
Our first step is to explain what a function of more than one variable is, starting with functions of two independent variables. This step includes identifying the domain and range of such functions and learning how to graph them. We also examine ways to relate the graphs of functions in three dimensions to graphs of more familiar planar functions.
The definition of a function of two variables is very similar to the definition for a function of one variable. The main difference is that, instead of mapping values of one variable to values of another variable, we map ordered pairs of variables to another variable.
A function of two variables
maps each ordered pair
in a subset
of the real plane
to a unique real number
The set
is called the domain of the function. The range of
is the set of all real numbers
that has at least one ordered pair
such that
as shown in the following figure.
Determining the domain of a function of two variables involves taking into account any domain restrictions that may exist. Let’s take a look.
Find the domain and range of each of the following functions:
and
that cause
to be undefined, so the domain of
is
To determine the range, first pick a value for
We need to find a solution to the equation
or
One such solution can be obtained by first setting
which yields the equation
The solution to this equation is
which gives the ordered pair
as a solution to the equation
for any value of
Therefore, the range of the function is all real numbers, or
to have a real value, the quantity under the square root must be nonnegative:
This inequality can be written in the form
Therefore, the domain of
is
The graph of this set of points can be described as a disk of radius
centered at the origin. The domain includes the boundary circle as shown in the following graph.
=9−x2−y2 is a closed disk of radius 3.")
To determine the range of
we start with a point
on the boundary of the domain, which is defined by the relation
It follows that
and
If
(in other words,
then
This is the maximum value of the function. Given any value c between
we can find an entire set of points inside the domain of
such that
Since
this describes a circle of radius
centered at the origin. Any point on this circle satisfies the equation
Therefore, the range of this function can be written in interval notation as
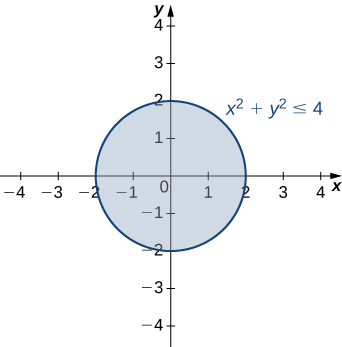
Find the domain and range of the function
The domain is the shaded circle defined by the inequality
which has a circle of radius
as its boundary. The range is
Determine the set of ordered pairs that do not make the radicand negative.
Suppose we wish to graph the function
This function has two independent variables
and one dependent variable
When graphing a function
of one variable, we use the Cartesian plane. We are able to graph any ordered pair
in the plane, and every point in the plane has an ordered pair
associated with it. With a function of two variables, each ordered pair
in the domain of the function is mapped to a real number
Therefore, the graph of the function
consists of ordered triples
The graph of a function
of two variables is called a surface.
To understand more completely the concept of plotting a set of ordered triples to obtain a surface in three-dimensional space, imagine the
coordinate system laying flat. Then, every point in the domain of the function
has a unique
associated with it. If
is positive, then the graphed point is located above the
if
is negative, then the graphed point is located below the
The set of all the graphed points becomes the two-dimensional surface that is the graph of the function
Create a graph of each of the following functions:
is
and the range is
When
we have
Therefore any point on the circle of radius
centered at the origin in the
maps to
in
If
then
so any point on the circle of radius
centered at the origin in the
maps to
in
As
gets closer to zero, the value of z approaches 3. When
then
This is the origin in the
If
is equal to any other value between
then
equals some other constant between
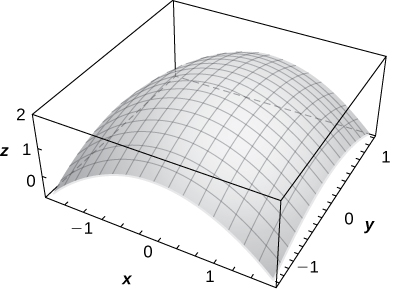
The surface described by this function is a hemisphere centered at the origin with radius
as shown in the following graph.

Setting this expression equal to various values starting at zero, we obtain circles of increasing radius. The minimum value of
is zero (attained when
When
the function becomes
and when
then the function becomes
These are cross-sections of the graph, and are parabolas. Recall from Introduction to Vectors in Space that the name of the graph of
is a paraboloid. The graph of
appears in the following graph.

A profit function for a hardware manufacturer is given by
where
is the number of nuts sold per month (measured in thousands) and
represents the number of bolts sold per month (measured in thousands). Profit is measured in thousands of dollars. Sketch a graph of this function.
This function is a polynomial function in two variables. The domain of
consists of
coordinate pairs that yield a nonnegative profit:
This is a disk of radius
centered at
A further restriction is that both
must be nonnegative. When
and
Note that it is possible for either value to be a noninteger; for example, it is possible to sell
thousand nuts in a month. The domain, therefore, contains thousands of points, so we can consider all points within the disk. For any
we can solve the equation
Since
we know that
so the previous equation describes a circle with radius
centered at the point
Therefore. the range of
is
The graph of
is also a paraboloid, and this paraboloid points downward as shown.

If hikers walk along rugged trails, they might use a topographical map that shows how steeply the trails change. A topographical map contains curved lines called contour lines. Each contour line corresponds to the points on the map that have equal elevation ([link]). A level curve of a function of two variables
is completely analogous to a contour line on a topographical map.
 A topographical map of Devil’s Tower, Wyoming. Lines that are close together indicate very steep terrain. (b) A perspective photo of Devil’s Tower shows just how steep its sides are. Notice the top of the tower has the same shape as the center of the topographical map.")
Given a function
and a number
in the range of
level curve of a function of two variables for the value
is defined to be the set of points satisfying the equation
Returning to the function
we can determine the level curves of this function. The range of
is the closed interval
First, we choose any number in this closed interval—say,
The level curve corresponding to
is described by the equation
To simplify, square both sides of this equation:
Now, multiply both sides of the equation by
and add
to each side:
This equation describes a circle centered at the origin with radius
Using values of
between
yields other circles also centered at the origin. If
then the circle has radius
so it consists solely of the origin. [link] is a graph of the level curves of this function corresponding to
Note that in the previous derivation it may be possible that we introduced extra solutions by squaring both sides. This is not the case here because the range of the square root function is nonnegative.
=9−x2−y2, using c=0,1,2, and 3 (c=3 corresponds to the origin).")
A graph of the various level curves of a function is called a contour map.
Given the function
find the level curve corresponding to
Then create a contour map for this function. What are the domain and range of
To find the level curve for
we set
and solve. This gives
We then square both sides and multiply both sides of the equation by
Now, we rearrange the terms, putting the
terms together and the
terms together, and add
to each side:
Next, we group the pairs of terms containing the same variable in parentheses, and factor
from the first pair:
Then we complete the square in each pair of parentheses and add the correct value to the right-hand side:
Next, we factor the left-hand side and simplify the right-hand side:
Last, we divide both sides by
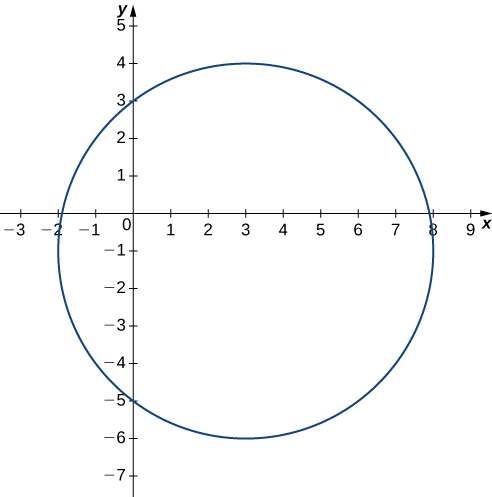
This equation describes an ellipse centered at
The graph of this ellipse appears in the following graph.
=8+8x−4y−4x2−y2 corresponding to c=0.")
We can repeat the same derivation for values of
less than
Then, [link] becomes
for an arbitrary value of
[link] shows a contour map for
using the values
When
the level curve is the point
=8+8x−4y−4x2−y2 using the values c=0,1,2,3,and4.")
Find and graph the level curve of the function
corresponding to
The equation of the level curve can be written as
which is a circle with radius
centered at
First, set
and then complete the square.
Another useful tool for understanding the graph of a function of two variables is called a vertical trace. Level curves are always graphed in the
but as their name implies, vertical traces are graphed in the
Consider a function
with domain
A vertical trace of the function can be either the set of points that solves the equation
for a given constant
or
for a given constant
Find vertical traces for the function
corresponding to
and
First set
in the equation
This describes a cosine graph in the plane
The other values of
appear in the following table.
| Vertical Trace for | |
|---|---|
In a similar fashion, we can substitute the
in the equation
to obtain the traces in the
as listed in the following table.
| Vertical Trace for | |
|---|---|
The three traces in the
are cosine functions; the three traces in the
are sine functions. These curves appear in the intersections of the surface with the planes
and
as shown in the following figure.
 are cosine curves in the xz-planes (a) and sine curves in the yz-planes (b).")
Determine the equation of the vertical trace of the function
corresponding to
and describe its graph.
This function describes a parabola opening downward in the plane
Set
in the equation
and complete the square.
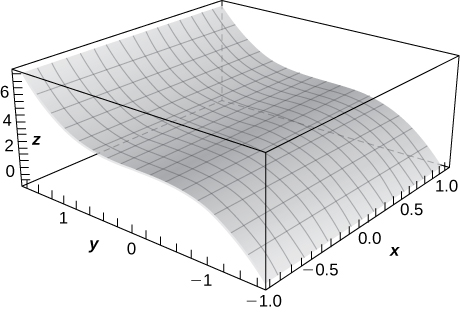
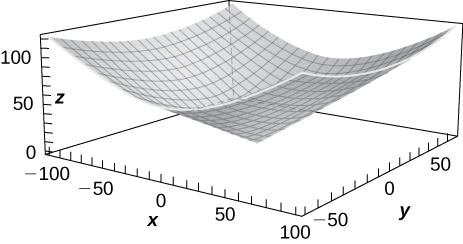
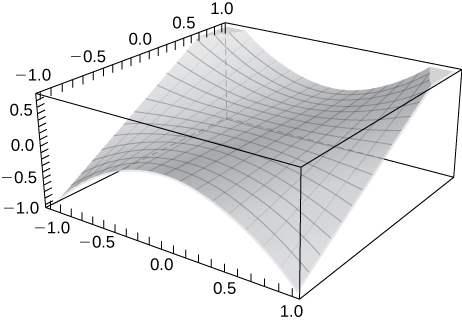
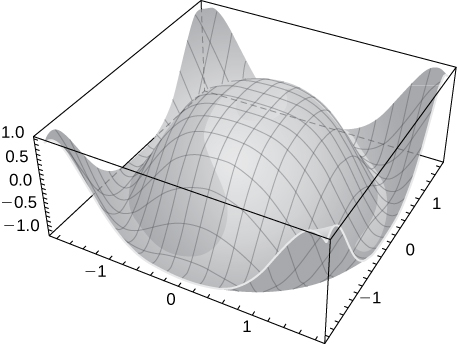
Functions of two variables can produce some striking-looking surfaces. The following figure shows two examples.
 a combination of a power function and a sine function and (b) a combination of trigonometric, exponential, and logarithmic functions.")
So far, we have examined only functions of two variables. However, it is useful to take a brief look at functions of more than two variables. Two such examples are
and
In the first function,
represents a point in space, and the function
maps each point in space to a fourth quantity, such as temperature or wind speed. In the second function,
can represent a point in the plane, and
can represent time. The function might map a point in the plane to a third quantity (for example, pressure) at a given time
The method for finding the domain of a function of more than two variables is analogous to the method for functions of one or two variables.
Find the domain of each of the following functions:
to be defined (and be a real value), two conditions must hold:
Combining these conditions leads to the inequality
Moving the variables to the other side and reversing the inequality gives the domain as
which describes a ball of radius
centered at the origin. (Note: The surface of the ball is not included in this domain.)
to be defined (and be a real value), two conditions must hold:
Since the radicand cannot be negative, this implies
and therefore that
Since the denominator cannot be zero,
or
Which can be rewritten as
which are the equations of two lines passing through the origin. Therefore, the domain of
is
Find the domain of the function
Check for values that make radicands negative or denominators equal to zero.
Functions of two variables have level curves, which are shown as curves in the
However, when the function has three variables, the curves become surfaces, so we can define level surfaces for functions of three variables.
Given a function
and a number
in the range of
a level surface of a function of three variables is defined to be the set of points satisfying the equation
Find the level surface for the function
corresponding to
The level surface is defined by the equation
This equation describes a hyperboloid of one sheet as shown in the following figure.

Find the equation of the level surface of the function
corresponding to
and describe the surface, if possible.
describes a sphere of radius
centered at the point
Set
and complete the square.
and can be studied using level curves and vertical traces.
for
or
for
For the following exercises, evaluate each function at the indicated values.
Find
Find
The volume of a right circular cylinder is calculated by a function of two variables,
where
is the radius of the right circular cylinder and
represents the height of the cylinder. Evaluate
and explain what this means.
This is the volume when the radius is
and the height is
An oxygen tank is constructed of a right cylinder of height
and radius
with two hemispheres of radius
mounted on the top and bottom of the cylinder. Express the volume of the cylinder as a function of two variables,
find
and explain what this means.
For the following exercises, find the domain of the function.
All points in the
All real ordered pairs in the
of the form
Find the range of the functions.
The set
For the following exercises, find the level curves of each function at the indicated value of
to visualize the given function.
a hyperbola
a line;
line through the origin
three lines
any constant
The level curves are parabolas of the form
For the following exercises, find the vertical traces of the functions at the indicated values of
and y, and plot the traces.
a curve in the
with rulings parallel to the
Find the domain of the following functions.
All points in
For the following exercises, plot a graph of the function.
Use technology to graph
Sketch the following by finding the level curves. Verify the graph using technology.
Describe the contour lines for several values of
for
The contour lines are circles.
Find the level surface for the functions of three variables and describe it.
a sphere of radius
a hyperboloid of one sheet
For the following exercises, find an equation of the level curve of
that contains the point
The strength
of an electric field at point
resulting from an infinitely long charged wire lying along the
is given by
where
is a positive constant. For simplicity, let
and find the equations of the level surfaces for
A thin plate made of iron is located in the
The temperature
in degrees Celsius at a point
is inversely proportional to the square of its distance from the origin. Express
as a function of
Refer to the preceding problem. Using the temperature function found there, determine the proportionality constant if the temperature at point
Use this constant to determine the temperature at point
Refer to the preceding problem. Find the level curves for
and describe what the level curves represent.
The level curves represent circles of radii
and
that maps each ordered pair
in a subset
of
to a unique real number
that satisfies the equation
plotted in three-dimensional Cartesian space
for some real number
in the range of
for some real number
in the range of
that solves the equation
for a given constant
or the set of ordered triples
that solves the equation
for a given constant

You can also download for free at http://cnx.org/contents/9a1df55a-b167-4736-b5ad-15d996704270@5.1
Attribution: