
In the preceding section, we used definite integrals to find the area between two curves. In this section, we use definite integrals to find volumes of three-dimensional solids. We consider three approaches—slicing, disks, and washers—for finding these volumes, depending on the characteristics of the solid.
Just as area is the numerical measure of a two-dimensional region, volume is the numerical measure of a three-dimensional solid. Most of us have computed volumes of solids by using basic geometric formulas. The volume of a rectangular solid, for example, can be computed by multiplying length, width, and height:
The formulas for the volume of a sphere
a cone
and a pyramid
have also been introduced. Although some of these formulas were derived using geometry alone, all these formulas can be obtained by using integration.
We can also calculate the volume of a cylinder. Although most of us think of a cylinder as having a circular base, such as a soup can or a metal rod, in mathematics the word cylinder has a more general meaning. To discuss cylinders in this more general context, we first need to define some vocabulary.
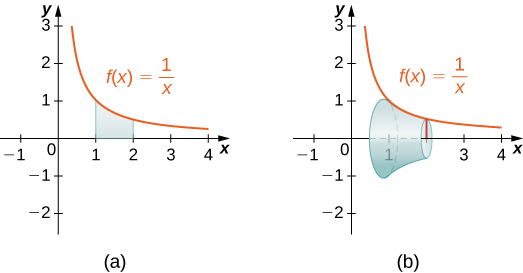
We define the cross-section of a solid to be the intersection of a plane with the solid. A cylinder is defined as any solid that can be generated by translating a plane region along a line perpendicular to the region, called the axis of the cylinder. Thus, all cross-sections perpendicular to the axis of a cylinder are identical. The solid shown in [link] is an example of a cylinder with a noncircular base. To calculate the volume of a cylinder, then, we simply multiply the area of the cross-section by the height of the cylinder:
In the case of a right circular cylinder (soup can), this becomes
If a solid does not have a constant cross-section (and it is not one of the other basic solids), we may not have a formula for its volume. In this case, we can use a definite integral to calculate the volume of the solid. We do this by slicing the solid into pieces, estimating the volume of each slice, and then adding those estimated volumes together. The slices should all be parallel to one another, and when we put all the slices together, we should get the whole solid. Consider, for example, the solid S shown in [link], extending along the

We want to divide
into slices perpendicular to the
As we see later in the chapter, there may be times when we want to slice the solid in some other direction—say, with slices perpendicular to the y-axis. The decision of which way to slice the solid is very important. If we make the wrong choice, the computations can get quite messy. Later in the chapter, we examine some of these situations in detail and look at how to decide which way to slice the solid. For the purposes of this section, however, we use slices perpendicular to the
Because the cross-sectional area is not constant, we let
represent the area of the cross-section at point
Now let
be a regular partition of
and for
let
represent the slice of
stretching from
The following figure shows the sliced solid with

Finally, for
let
be an arbitrary point in
Then the volume of slice
can be estimated by
Adding these approximations together, we see the volume of the entire solid
can be approximated by
By now, we can recognize this as a Riemann sum, and our next step is to take the limit as
Then we have
The technique we have just described is called the slicing method. To apply it, we use the following strategy.
Recall that in this section, we assume the slices are perpendicular to the
Therefore, the area formula is in terms of x and the limits of integration lie on the
However, the problem-solving strategy shown here is valid regardless of how we choose to slice the solid.
We know from geometry that the formula for the volume of a pyramid is
If the pyramid has a square base, this becomes
where
denotes the length of one side of the base. We are going to use the slicing method to derive this formula.
We want to apply the slicing method to a pyramid with a square base. To set up the integral, consider the pyramid shown in [link], oriented along the
 A pyramid with a square base is oriented along the x-axis. (b) A two-dimensional view of the pyramid is seen from the side.")
We first want to determine the shape of a cross-section of the pyramid. We are know the base is a square, so the cross-sections are squares as well (step 1). Now we want to determine a formula for the area of one of these cross-sectional squares. Looking at [link](b), and using a proportion, since these are similar triangles, we have
Therefore, the area of one of the cross-sectional squares is
Then we find the volume of the pyramid by integrating from
(step
This is the formula we were looking for.
Use the slicing method to derive the formula
for the volume of a circular cone.
Use similar triangles, as in [link].
If a region in a plane is revolved around a line in that plane, the resulting solid is called a solid of revolution, as shown in the following figure.
 This is the region that is revolved around the x-axis. (b) As the region begins to revolve around the axis, it sweeps out a solid of revolution. (c) This is the solid that results when the revolution is complete.")
Solids of revolution are common in mechanical applications, such as machine parts produced by a lathe. We spend the rest of this section looking at solids of this type. The next example uses the slicing method to calculate the volume of a solid of revolution.
Use an online integral calculator to learn more.
Use the slicing method to find the volume of the solid of revolution bounded by the graphs of
and rotated about the
Using the problem-solving strategy, we first sketch the graph of the quadratic function over the interval
as shown in the following figure.

Next, revolve the region around the x-axis, as shown in the following figure.
 and (b), of the solid of revolution produced by revolving the region in [link] about the x-axis.")
Since the solid was formed by revolving the region around the
the cross-sections are circles (step 1). The area of the cross-section, then, is the area of a circle, and the radius of the circle is given by
Use the formula for the area of the circle:
The volume, then, is (step 3)
The volume is
Use the method of slicing to find the volume of the solid of revolution formed by revolving the region between the graph of the function
and the
over the interval
around the
See the following figure.
Use the problem-solving strategy presented earlier and follow [link] to help with step 2.
When we use the slicing method with solids of revolution, it is often called the disk method because, for solids of revolution, the slices used to over approximate the volume of the solid are disks. To see this, consider the solid of revolution generated by revolving the region between the graph of the function
and the
over the interval
around the
The graph of the function and a representative disk are shown in [link](a) and (b). The region of revolution and the resulting solid are shown in [link](c) and (d).
 A thin rectangle for approximating the area under a curve. (b) A representative disk formed by revolving the rectangle about the x-axis. (c) The region under the curve is revolved about the x-axis, resulting in (d) the solid of revolution.")
We already used the formal Riemann sum development of the volume formula when we developed the slicing method. We know that
The only difference with the disk method is that we know the formula for the cross-sectional area ahead of time; it is the area of a circle. This gives the following rule.
Let
be continuous and nonnegative. Define
as the region bounded above by the graph of
below by the
on the left by the line
and on the right by the line
Then, the volume of the solid of revolution formed by revolving
around the
is given by
The volume of the solid we have been studying ([link]) is given by
Let’s look at some examples.
Use the disk method to find the volume of the solid of revolution generated by rotating the region between the graph of
and the
over the interval
around the
The graphs of the function and the solid of revolution are shown in the following figure.
 The function f(x)=x over the interval [1,4]. (b) The solid of revolution obtained by revolving the region under the graph of f(x) about the x-axis.")
We have
The volume is
units3.
Use the disk method to find the volume of the solid of revolution generated by rotating the region between the graph of
and the
over the interval
around the
units3
Use the procedure from [link].
So far, our examples have all concerned regions revolved around the
but we can generate a solid of revolution by revolving a plane region around any horizontal or vertical line. In the next example, we look at a solid of revolution that has been generated by revolving a region around the
The mechanics of the disk method are nearly the same as when the
is the axis of revolution, but we express the function in terms of
and we integrate with respect to y as well. This is summarized in the following rule.
Let
be continuous and nonnegative. Define
as the region bounded on the right by the graph of
on the left by the
below by the line
and above by the line
Then, the volume of the solid of revolution formed by revolving
around the
is given by
The next example shows how this rule works in practice.
Let
be the region bounded by the graph of
and the
over the
interval
Use the disk method to find the volume of the solid of revolution generated by rotating
around the
[link] shows the function and a representative disk that can be used to estimate the volume. Notice that since we are revolving the function around the
the disks are horizontal, rather than vertical.
 Shown is a thin rectangle between the curve of the function g(y)=4−y and the y-axis. (b) The rectangle forms a representative disk after revolution around the y-axis.")
The region to be revolved and the full solid of revolution are depicted in the following figure.
 The region to the left of the function g(y)=4−y over the y-axis interval [0,4]. (b) The solid of revolution formed by revolving the region about the y-axis.")
To find the volume, we integrate with respect to
We obtain
The volume is
units3.
Use the disk method to find the volume of the solid of revolution generated by rotating the region between the graph of
and the
over the interval
around the
units3
Use the procedure from [link].
Some solids of revolution have cavities in the middle; they are not solid all the way to the axis of revolution. Sometimes, this is just a result of the way the region of revolution is shaped with respect to the axis of revolution. In other cases, cavities arise when the region of revolution is defined as the region between the graphs of two functions. A third way this can happen is when an axis of revolution other than the
or
is selected.
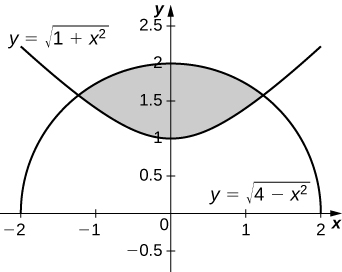
When the solid of revolution has a cavity in the middle, the slices used to approximate the volume are not disks, but washers (disks with holes in the center). For example, consider the region bounded above by the graph of the function
and below by the graph of the function
over the interval
When this region is revolved around the
the result is a solid with a cavity in the middle, and the slices are washers. The graph of the function and a representative washer are shown in [link](a) and (b). The region of revolution and the resulting solid are shown in [link](c) and (d).
 A thin rectangle in the region between two curves. (b) A representative disk formed by revolving the rectangle about the x-axis. (c) The region between the curves over the given interval. (d) The resulting solid of revolution.")
The cross-sectional area, then, is the area of the outer circle less the area of the inner circle. In this case,
Then the volume of the solid is
Generalizing this process gives the washer method.
Suppose
and
are continuous, nonnegative functions such that
over
Let
denote the region bounded above by the graph of
below by the graph of
on the left by the line
and on the right by the line
Then, the volume of the solid of revolution formed by revolving
around the
is given by
Find the volume of a solid of revolution formed by revolving the region bounded above by the graph of
and below by the graph of
over the interval
around the
The graphs of the functions and the solid of revolution are shown in the following figure.
 The region between the graphs of the functions f(x)=x and g(x)=1/x over the interval [1,4]. (b) Revolving the region about the x-axis generates a solid of revolution with a cavity in the middle.")
We have
Find the volume of a solid of revolution formed by revolving the region bounded by the graphs of
and
over the interval
around the
units3
Graph the functions to determine which graph forms the upper bound and which graph forms the lower bound, then use the procedure from [link].
As with the disk method, we can also apply the washer method to solids of revolution that result from revolving a region around the y-axis. In this case, the following rule applies.
Suppose
and
are continuous, nonnegative functions such that
for
Let
denote the region bounded on the right by the graph of
on the left by the graph of
below by the line
and above by the line
Then, the volume of the solid of revolution formed by revolving
around the
is given by
Rather than looking at an example of the washer method with the
as the axis of revolution, we now consider an example in which the axis of revolution is a line other than one of the two coordinate axes. The same general method applies, but you may have to visualize just how to describe the cross-sectional area of the volume.
Find the volume of a solid of revolution formed by revolving the region bounded above by
and below by the
over the interval
around the line
The graph of the region and the solid of revolution are shown in the following figure.
 The region between the graph of the function f(x)=4−x and the x-axis over the interval [0,4]. (b) Revolving the region about the line y=−2 generates a solid of revolution with a cylindrical hole through its middle.")
We can’t apply the volume formula to this problem directly because the axis of revolution is not one of the coordinate axes. However, we still know that the area of the cross-section is the area of the outer circle less the area of the inner circle. Looking at the graph of the function, we see the radius of the outer circle is given by
which simplifies to
The radius of the inner circle is
Therefore, we have
Find the volume of a solid of revolution formed by revolving the region bounded above by the graph of
and below by the
over the interval
around the line
units3
Use the procedure from [link].
Derive the formula for the volume of a sphere using the slicing method.
Use the slicing method to derive the formula for the volume of a cone.
Use the slicing method to derive the formula for the volume of a tetrahedron with side length
Use the disk method to derive the formula for the volume of a trapezoidal cylinder.
Explain when you would use the disk method versus the washer method. When are they interchangeable?
For the following exercises, draw a typical slice and find the volume using the slicing method for the given volume.
A pyramid with height 6 units and square base of side 2 units, as pictured here.
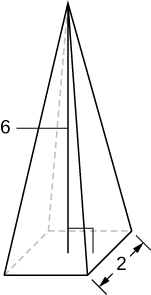
8 units3
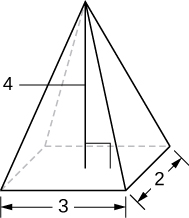
A pyramid with height 4 units and a rectangular base with length 2 units and width 3 units, as pictured here.
A tetrahedron with a base side of 4 units, as seen here.
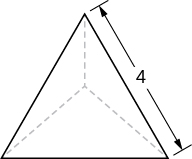
units3
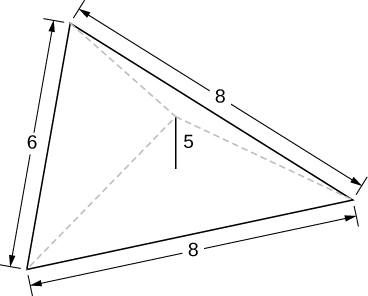
A pyramid with height 5 units, and an isosceles triangular base with lengths of 6 units and 8 units, as seen here.
A cone of radius
and height
has a smaller cone of radius
and height
removed from the top, as seen here. The resulting solid is called a frustum.
units3
For the following exercises, draw an outline of the solid and find the volume using the slicing method.
The base is a circle of radius
The slices perpendicular to the base are squares.
The base is a triangle with vertices
and
Slices perpendicular to the xy-plane are semicircles.
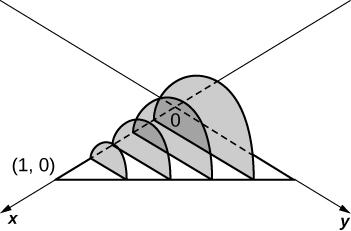
units3
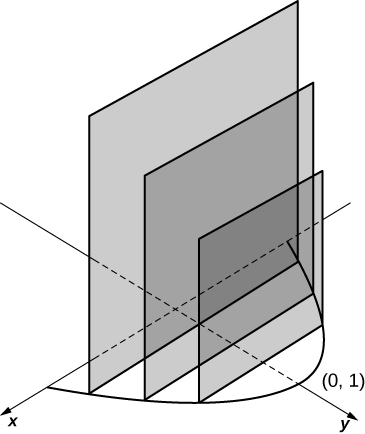
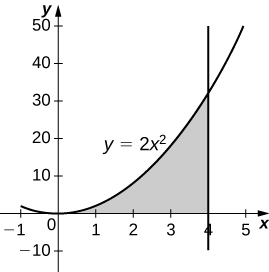
The base is the region under the parabola
in the first quadrant. Slices perpendicular to the xy-plane are squares.
The base is the region under the parabola
and above the
Slices perpendicular to the
are squares.
units3
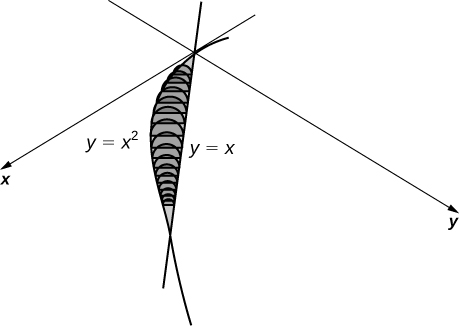
The base is the region enclosed by
and
Slices perpendicular to the x-axis are right isosceles triangles.
The base is the area between
and
Slices perpendicular to the x-axis are semicircles.
units3
For the following exercises, draw the region bounded by the curves. Then, use the disk method to find the volume when the region is rotated around the x-axis.
units3
units3
units3
units3
For the following exercises, draw the region bounded by the curves. Then, find the volume when the region is rotated around the y-axis.
units3
units3
units3
units3
For the following exercises, draw the region bounded by the curves. Then, find the volume when the region is rotated around the x-axis.
units3
units3
[T]
units3
units3
For the following exercises, draw the region bounded by the curves. Then, use the washer method to find the volume when the region is revolved around the y-axis.
units3
units3
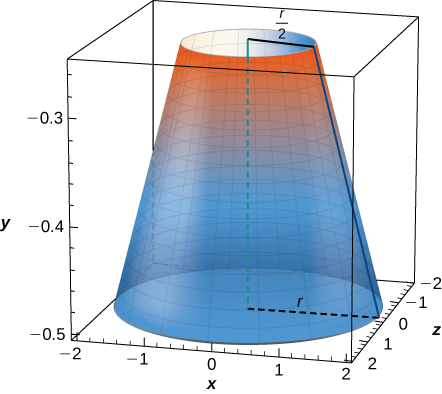
Yogurt containers can be shaped like frustums. Rotate the line
around the y-axis to find the volume between
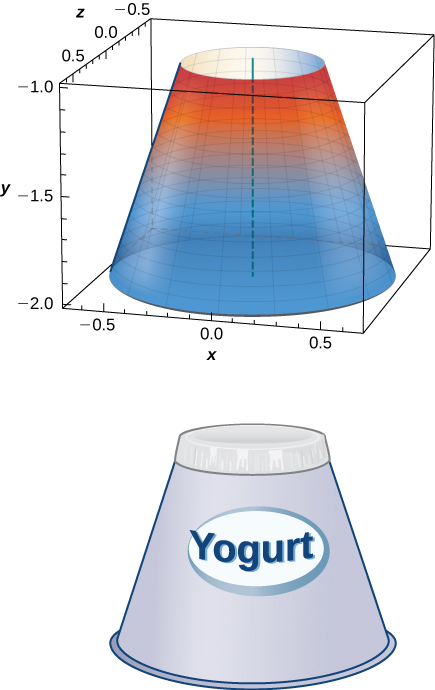
units3
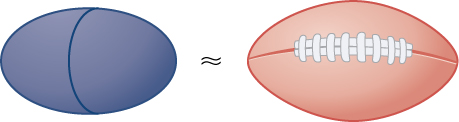
Rotate the ellipse
around the x-axis to approximate the volume of a football, as seen here.
Rotate the ellipse
around the y-axis to approximate the volume of a football.
units3
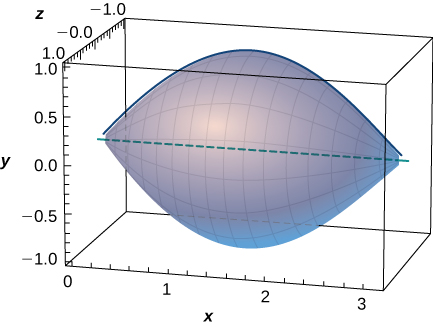
A better approximation of the volume of a football is given by the solid that comes from rotating
around the x-axis from
to
What is the volume of this football approximation, as seen here?
What is the volume of the Bundt cake that comes from rotating
around the y-axis from
to
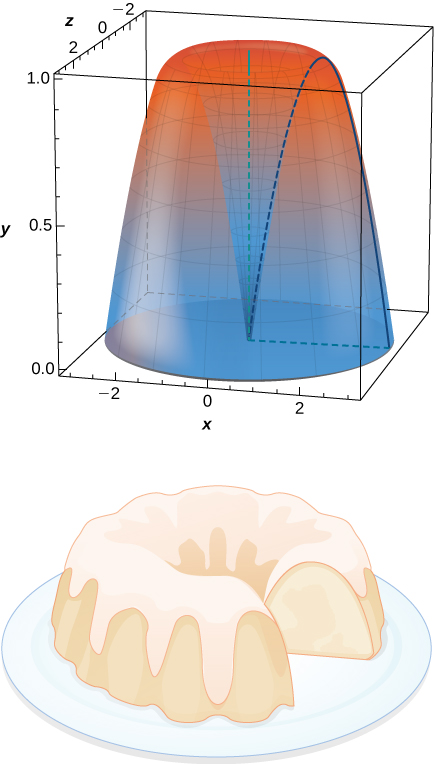
units3
For the following exercises, find the volume of the solid described.
The base is the region between
and
Slices perpendicular to the x-axis are semicircles.
The base is the region enclosed by the generic ellipse
Slices perpendicular to the x-axis are semicircles.
units3
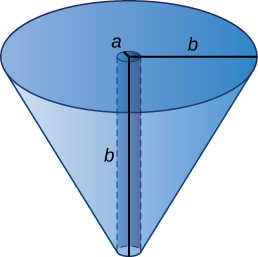
Bore a hole of radius
down the axis of a right cone and through the base of radius
as seen here.
Find the volume common to two spheres of radius
with centers that are
apart, as shown here.
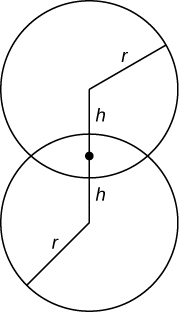
units3
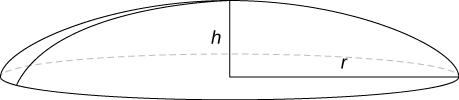
Find the volume of a spherical cap of height
and radius
where
as seen here.
Find the volume of a sphere of radius
with a cap of height
removed from the top, as seen here.
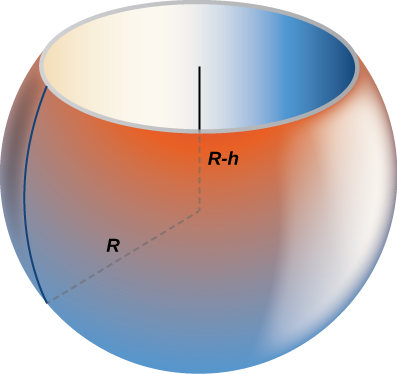
units3

You can also download for free at http://cnx.org/contents/9a1df55a-b167-4736-b5ad-15d996704270@5.1
Attribution: