")
In this section, you will:
Emily is a college student who plans to spend a summer in Seattle. She has saved $3,500 for her trip and anticipates spending $400 each week on rent, food, and activities. How can we write a linear model to represent her situation? What would be the x-intercept, and what can she learn from it? To answer these and related questions, we can create a model using a linear function. Models such as this one can be extremely useful for analyzing relationships and making predictions based on those relationships. In this section, we will explore examples of linear function models.
When modeling scenarios with linear functions and solving problems involving quantities with a constant rate of change, we typically follow the same problem strategies that we would use for any type of function. Let’s briefly review them:
Now let’s take a look at the student in Seattle. In her situation, there are two changing quantities: time and money. The amount of money she has remaining while on vacation depends on how long she stays. We can use this information to define our variables, including units.
money remaining, in dollars
time, in weeks
So, the amount of money remaining depends on the number of weeks:
We can also identify the initial value and the rate of change.
Notice that the unit of dollars per week matches the unit of our output variable divided by our input variable. Also, because the slope is negative, the linear function is decreasing. This should make sense because she is spending money each week.
The rate of change is constant, so we can start with the linear model
Then we can substitute the intercept and slope provided.
 To find the
intercept, we set the output to zero, and solve for the input.
The
intercept is 8.75 weeks. Because this represents the input value when the output will be zero, we could say that Emily will have no money left after 8.75 weeks.
When modeling any real-life scenario with functions, there is typically a limited domain over which that model will be valid—almost no trend continues indefinitely. Here the domain refers to the number of weeks. In this case, it doesn’t make sense to talk about input values less than zero. A negative input value could refer to a number of weeks before she saved $3,500, but the scenario discussed poses the question once she saved $3,500 because this is when her trip and subsequent spending starts. It is also likely that this model is not valid after the
intercept, unless Emily will use a credit card and goes into debt. The domain represents the set of input values, so the reasonable domain for this function is
In the above example, we were given a written description of the situation. We followed the steps of modeling a problem to analyze the information. However, the information provided may not always be the same. Sometimes we might be provided with an intercept. Other times we might be provided with an output value. We must be careful to analyze the information we are given, and use it appropriately to build a linear model.
Some real-world problems provide the
intercept, which is the constant or initial value. Once the
intercept is known, the
intercept can be calculated. Suppose, for example, that Hannah plans to pay off a no-interest loan from her parents. Her loan balance is $1,000. She plans to pay $250 per month until her balance is $0. The
intercept is the initial amount of her debt, or $1,000. The rate of change, or slope, is -$250 per month. We can then use the slope-intercept form and the given information to develop a linear model.
Now we can set the function equal to 0, and solve for
to find the
intercept.
The
intercept is the number of months it takes her to reach a balance of $0. The
intercept is 4 months, so it will take Hannah four months to pay off her loan.
Many real-world applications are not as direct as the ones we just considered. Instead they require us to identify some aspect of a linear function. We might sometimes instead be asked to evaluate the linear model at a given input or set the equation of the linear model equal to a specified output.
Given a word problem that includes two pairs of input and output values, use the linear function to solve a problem.
value.
value that results in a given
value.
A town’s population has been growing linearly. In 2004 the population was 6,200. By 2009 the population had grown to 8,100. Assume this trend continues.
The two changing quantities are the population size and time. While we could use the actual year value as the input quantity, doing so tends to lead to very cumbersome equations because the
intercept would correspond to the year 0, more than 2000 years ago!
To make computation a little nicer, we will define our input as the number of years since 2004:
years since 2004
the town’s population
To predict the population in 2013
we would first need an equation for the population. Likewise, to find when the population would reach 15,000, we would need to solve for the input that would provide an output of 15,000. To write an equation, we need the initial value and the rate of change, or slope.
To determine the rate of change, we will use the change in output per change in input.
The problem gives us two input-output pairs. Converting them to match our defined variables, the year 2004 would correspond to
giving the point
Notice that through our clever choice of variable definition, we have “given” ourselves the y-intercept of the function. The year 2009 would correspond to
giving the point
The two coordinate pairs are
and
Recall that we encountered examples in which we were provided two points earlier in the chapter. We can use these values to calculate the slope.
We already know the y-intercept of the line, so we can immediately write the equation:
To predict the population in 2013, we evaluate our function at
If the trend continues, our model predicts a population of 9,620 in 2013.
To find when the population will reach 15,000, we can set
and solve for
Our model predicts the population will reach 15,000 in a little more than 23 years after 2004, or somewhere around the year 2027.
A company sells doughnuts. They incur a fixed cost of $25,000 for rent, insurance, and other expenses. It costs $0.25 to produce each doughnut.
of the company as a function of
the number of doughnuts produced.
The y-intercept is If the company does not produce a single doughnut, they still incur a cost of $25,000.
A city’s population has been growing linearly. In 2008, the population was 28,200. By 2012, the population was 36,800. Assume this trend continues.
41,100 2020
It is useful for many real-world applications to draw a picture to gain a sense of how the variables representing the input and output may be used to answer a question. To draw the picture, first consider what the problem is asking for. Then, determine the input and the output. The diagram should relate the variables. Often, geometrical shapes or figures are drawn. Distances are often traced out. If a right triangle is sketched, the Pythagorean Theorem relates the sides. If a rectangle is sketched, labeling width and height is helpful.
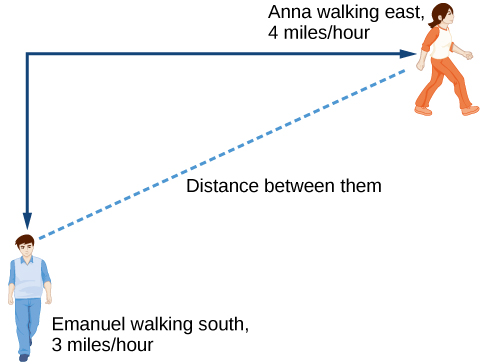
Anna and Emanuel start at the same intersection. Anna walks east at 4 miles per hour while Emanuel walks south at 3 miles per hour. They are communicating with a two-way radio that has a range of 2 miles. How long after they start walking will they fall out of radio contact?
In essence, we can partially answer this question by saying they will fall out of radio contact when they are 2 miles apart, which leads us to ask a new question:
“How long will it take them to be 2 miles apart?”
In this problem, our changing quantities are time and position, but ultimately we need to know how long will it take for them to be 2 miles apart. We can see that time will be our input variable, so we’ll define our input and output variables.
time in hours.
distance in miles, and
distance in miles
Because it is not obvious how to define our output variable, we’ll start by drawing a picture such as [link].
Initial Value: They both start at the same intersection so when
the distance traveled by each person should also be 0. Thus the initial value for each is 0.
Rate of Change: Anna is walking 4 miles per hour and Emanuel is walking 3 miles per hour, which are both rates of change. The slope for
is 4 and the slope for
is 3.
Using those values, we can write formulas for the distance each person has walked.
For this problem, the distances from the starting point are important. To notate these, we can define a coordinate system, identifying the “starting point” at the intersection where they both started. Then we can use the variable,
which we introduced above, to represent Anna’s position, and define it to be a measurement from the starting point in the eastward direction. Likewise, can use the variable,
to represent Emanuel’s position, measured from the starting point in the southward direction. Note that in defining the coordinate system, we specified both the starting point of the measurement and the direction of measure.
We can then define a third variable,
to be the measurement of the distance between Anna and Emanuel. Showing the variables on the diagram is often helpful, as we can see from [link].
Recall that we need to know how long it takes for
the distance between them, to equal 2 miles. Notice that for any given input
the outputs
and
represent distances.
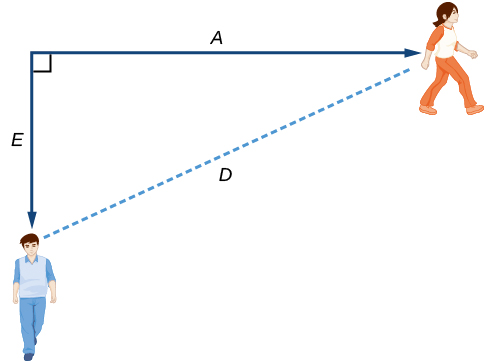
[link] shows us that we can use the Pythagorean Theorem because we have drawn a right angle.
Using the Pythagorean Theorem, we get:* * *
In this scenario we are considering only positive values of
so our distance
will always be positive. We can simplify this answer to
This means that the distance between Anna and Emanuel is also a linear function. Because
is a linear function, we can now answer the question of when the distance between them will reach 2 miles. We will set the output
and solve for
They will fall out of radio contact in 0.4 hours, or 24 minutes.
Should I draw diagrams when given information based on a geometric shape?
Yes. Sketch the figure and label the quantities and unknowns on the sketch.
There is a straight road leading from the town of Westborough to Agritown 30 miles east and 10 miles north. Partway down this road, it junctions with a second road, perpendicular to the first, leading to the town of Eastborough. If the town of Eastborough is located 20 miles directly east of the town of Westborough, how far is the road junction from Westborough?
It might help here to draw a picture of the situation. See [link]. It would then be helpful to introduce a coordinate system. While we could place the origin anywhere, placing it at Westborough seems convenient. This puts Agritown at coordinates
and Eastborough at
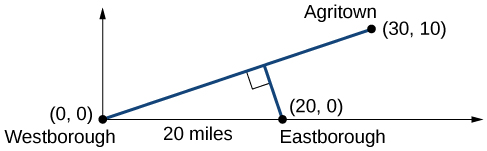
Using this point along with the origin, we can find the slope of the line from Westborough to Agritown:
The equation of the road from Westborough to Agritown would be
From this, we can determine the perpendicular road to Eastborough will have slope
Because the town of Eastborough is at the point (20, 0), we can find the equation:
We can now find the coordinates of the junction of the roads by finding the intersection of these lines. Setting them equal,
The roads intersect at the point (18, 6). Using the distance formula, we can now find the distance from Westborough to the junction.* * *
One nice use of linear models is to take advantage of the fact that the graphs of these functions are lines. This means real-world applications discussing maps need linear functions to model the distances between reference points.
There is a straight road leading from the town of Timpson to Ashburn 60 miles east and 12 miles north. Partway down the road, it junctions with a second road, perpendicular to the first, leading to the town of Garrison. If the town of Garrison is located 22 miles directly east of the town of Timpson, how far is the road junction from Timpson?
21.15 miles
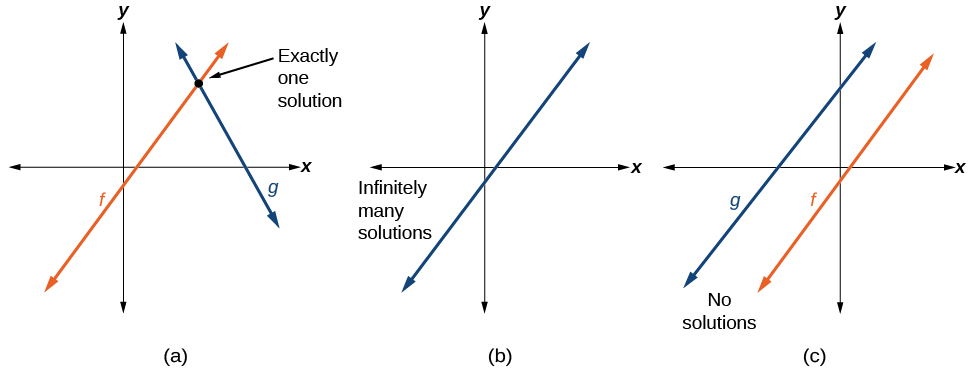
Real-world situations including two or more linear functions may be modeled with a system of linear equations. Remember, when solving a system of linear equations, we are looking for points the two lines have in common. Typically, there are three types of answers possible, as shown in [link].
Given a situation that represents a system of linear equations, write the system of equations and identify the solution.
or find the point of intersection on a graph.
Jamal is choosing between two truck-rental companies. The first, Keep on Trucking, Inc., charges an up-front fee of $20, then 59 cents a mile. The second, Move It Your Way, charges an up-front fee of $16, then 63 cents a mile1. When will Keep on Trucking, Inc. be the better choice for Jamal?
The two important quantities in this problem are the cost and the number of miles driven. Because we have two companies to consider, we will define two functions.
| Input | distance driven in miles |
| Outputs | cost, in dollars, for renting from Keep on Trucking cost, in dollars, for renting from Move It Your Way |
| Initial Value | Up-front fee: and |
| Rate of Change | /mile and/mile |
A linear function is of the form
Using the rates of change and initial charges, we can write the equations
Using these equations, we can determine when Keep on Trucking, Inc., will be the better choice. Because all we have to make that decision from is the costs, we are looking for when Move It Your Way, will cost less, or when
The solution pathway will lead us to find the equations for the two functions, find the intersection, and then see where the
function is smaller.
These graphs are sketched in [link], with
in blue.
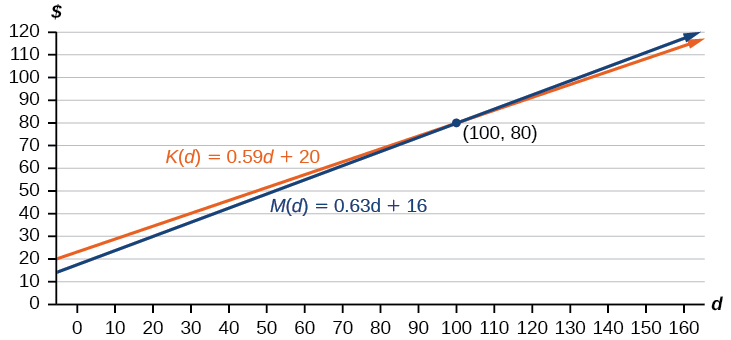
To find the intersection, we set the equations equal and solve:
This tells us that the cost from the two companies will be the same if 100 miles are driven. Either by looking at the graph, or noting that
is growing at a slower rate, we can conclude that Keep on Trucking, Inc. will be the cheaper price when more than 100 miles are driven, that is
Access this online resource for additional instruction and practice with linear function models.
which is setting the expression
equal to 0.
Explain how to find the input variable in a word problem that uses a linear function.
Determine the independent variable. This is the variable upon which the output depends.
Explain how to find the output variable in a word problem that uses a linear function.
Explain how to interpret the initial value in a word problem that uses a linear function.
To determine the initial value, find the output when the input is equal to zero.
Explain how to determine the slope in a word problem that uses a linear function.
Find the area of a parallelogram bounded by the y-axis, the line
the line
and the line parallel to
passing through
6 square units
Find the area of a triangle bounded by the x-axis, the line
and the line perpendicular to
that passes through the origin.
Find the area of a triangle bounded by the y-axis, the line
and the line perpendicular to
that passes through the origin.
20.012 square units
Find the area of a parallelogram bounded by the x-axis, the line
the line
and the line parallel to
passing through
For the following exercises, consider this scenario: A town’s population has been decreasing at a constant rate. In 2010 the population was 5,900. By 2012 the population had dropped 4,700. Assume this trend continues.
Predict the population in 2016.
2,300
Identify the year in which the population will reach 0.
For the following exercises, consider this scenario: A town’s population has been increased at a constant rate. In 2010 the population was 46,020. By 2012 the population had increased to 52,070. Assume this trend continues.
Predict the population in 2016.
64,170
Identify the year in which the population will reach 75,000.
For the following exercises, consider this scenario: A town has an initial population of 75,000. It grows at a constant rate of 2,500 per year for 5 years.
Find the linear function that models the town’s population
as a function of the year,
where
is the number of years since the model began.
Find a reasonable domain and range for the function
If the function
is graphed, find and interpret the x- and y-intercepts.
(–30, 0) Thirty years before the start of this model, the town had no citizens. (0, 75,000) Initially, the town had a population of 75,000.
If the function
is graphed, find and interpret the slope of the function.
When will the output reached 100,000?
Ten years after the model began.
What is the output in the year 12 years from the onset of the model?
For the following exercises, consider this scenario: The weight of a newborn is 7.5 pounds. The baby gained one-half pound a month for its first year.
Find the linear function that models the baby’s weight
as a function of the age of the baby, in months,
Find a reasonable domain and range for the function
.
If the function
is graphed, find and interpret the x- and y-intercepts.
The baby weighed 7.5 pounds at birth.
If the function W is graphed, find and interpret the slope of the function.
When did the baby weight 10.4 pounds?
At age 5.8 months.
What is the output when the input is 6.2? Interpret your answer.
For the following exercises, consider this scenario: The number of people afflicted with the common cold in the winter months steadily decreased by 205 each year from 2005 until 2010. In 2005, 12,025 people were afflicted.
Find the linear function that models the number of people inflicted with the common cold
as a function of the year,
Find a reasonable domain and range for the function
If the function
is graphed, find and interpret the x- and y-intercepts.
Initially there were 12,025 people afflicted by the common cold.
If the function
is graphed, find and interpret the slope of the function.
When will the output reach 0?
2064
In what year will the number of people be 9,700?
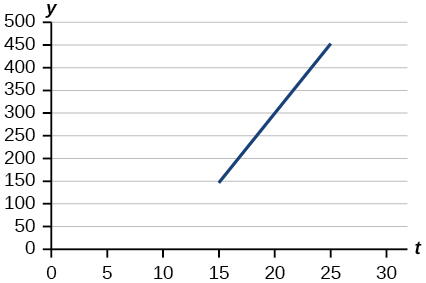
For the following exercises, use the graph in [link], which shows the profit,
in thousands of dollars, of a company in a given year,
where
represents the number of years since 1980.
Find the linear function
where
depends on
the number of years since 1980.
Find and interpret the y-intercept.
Find and interpret the x-intercept.
In 2070, the company’s profit will be zero.
Find and interpret the slope.
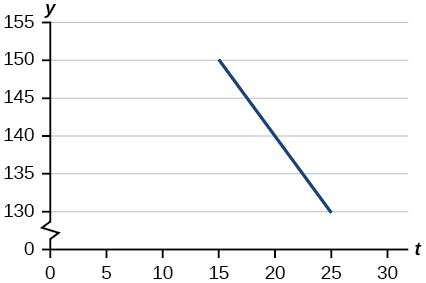
For the following exercises, use the graph in [link], which shows the profit,
in thousands of dollars, of a company in a given year,
where
represents the number of years since 1980.
Find the linear function
where
depends on
the number of years since 1980.
Find and interpret the y-intercept.
Find and interpret the x-intercept.
(10, 0) In 1990, the profit earned zero profit.
Find and interpret the slope.
For the following exercises, use the median home values in Mississippi and Hawaii (adjusted for inflation) shown in [link]. Assume that the house values are changing linearly.
| Year | Mississippi | Hawaii |
|---|---|---|
| 1950 | $25,200 | $74,400 |
| 2000 | $71,400 | $272,700 |
In which state have home values increased at a higher rate?
Hawaii
If these trends were to continue, what would be the median home value in Mississippi in 2010?
If we assume the linear trend existed before 1950 and continues after 2000, the two states’ median house values will be (or were) equal in what year? (The answer might be absurd.)
During the year 1933
For the following exercises, use the median home values in Indiana and Alabama (adjusted for inflation) shown in [link]. Assume that the house values are changing linearly.
| Year | Indiana | Alabama |
|---|---|---|
| 1950 | $37,700 | $27,100 |
| 2000 | $94,300 | $85,100 |
In which state have home values increased at a higher rate?
If these trends were to continue, what would be the median home value in Indiana in 2010?
$105,620
If we assume the linear trend existed before 1950 and continues after 2000, the two states’ median house values will be (or were) equal in what year? (The answer might be absurd.)
In 2004, a school population was 1,001. By 2008 the population had grown to 1,697. Assume the population is changing linearly.
of the school t years after 2000.
696 people 4 years 174 people per year 305 people 2,219 people
In 2003, a town’s population was 1,431. By 2007 the population had grown to 2,134. Assume the population is changing linearly.
of the town
years after 2000.
A phone company has a monthly cellular plan where a customer pays a flat monthly fee and then a certain amount of money per minute used on the phone. If a customer uses 410 minutes, the monthly cost will be $71.50. If the customer uses 720 minutes, the monthly cost will be $118.
The flat monthly fee is $10 and there is an additional $0.15 fee for each additional minute used $113.05
A phone company has a monthly cellular data plan where a customer pays a flat monthly fee of $10 and then a certain amount of money per megabyte (MB) of data used on the phone. If a customer uses 20 MB, the monthly cost will be $11.20. If the customer uses 130 MB, the monthly cost will be $17.80.
, the number of MB used.
In 1991, the moose population in a park was measured to be 4,360. By 1999, the population was measured again to be 5,880. Assume the population continues to change linearly.
6,640 moose
In 2003, the owl population in a park was measured to be 340. By 2007, the population was measured again to be 285. The population changes linearly. Let the input be years since 1990.
Let the input be years since 2003.
The Federal Helium Reserve held about 16 billion cubic feet of helium in 2010 and is being depleted by about 2.1 billion cubic feet each year.
in terms of
the number of years since 2010.
5.5 billion cubic feet During the year 2017
Suppose the world’s oil reserves in 2014 are 1,820 billion barrels. If, on average, the total reserves are decreasing by 25 billion barrels of oil each year:
in terms of
the number of years since now.
You are choosing between two different prepaid cell phone plans. The first plan charges a rate of 26 cents per minute. The second plan charges a monthly fee of $19.95 plus 11 cents per minute. How many minutes would you have to use in a month in order for the second plan to be preferable?
More than 133 minutes
You are choosing between two different window washing companies. The first charges $5 per window. The second charges a base fee of $40 plus $3 per window. How many windows would you need to have for the second company to be preferable?
When hired at a new job selling jewelry, you are given two pay options:
How much jewelry would you need to sell for option A to produce a larger income?
More than $42,857.14 worth of jewelry
When hired at a new job selling electronics, you are given two pay options:
How much electronics would you need to sell for option A to produce a larger income?
When hired at a new job selling electronics, you are given two pay options:
How much electronics would you need to sell for option A to produce a larger income?
$66,666.67
When hired at a new job selling electronics, you are given two pay options:
How much electronics would you need to sell for option A to produce a larger income?

You can also download for free at http://cnx.org/contents/fd53eae1-fa23-47c7-bb1b-972349835c3c@8.1
Attribution: